Debugger
Every programmer knows Lubarsky's Law of Cybernetic Entomology, even if they are not familiar with the name: There's always one more bug. techBASIC has several features to help you tame cybernetic arthropods.

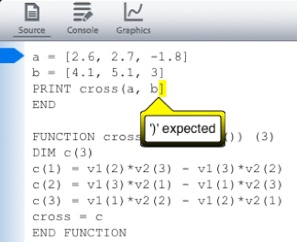
If there is a compile error in your program, or if techBASIC detects a problem while the program is running, an error message is shown. The approximate location is highlighted, and an error message describes the problem.
Setting and Clearing Breakpoints
Setting a breakpoint lets you stop a program at a specific location, examining the current values for variables and watching them change as you step line-by-line through the program. The blue bar to the left of the Source view is the breakpoint bar. Tap on the breakpoint bar to set a breakpoint; tap again to clear it. A line with a breakpoint displays a blue marker like the one shown here.
With a breakpoint set, running the program will stop it at the first breakpoint encountered.

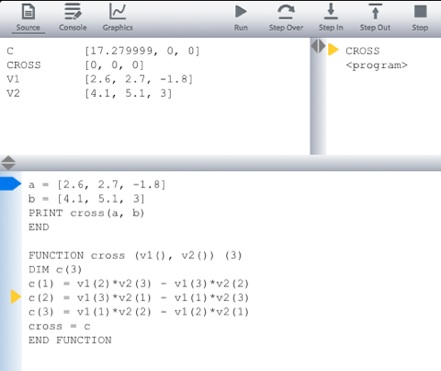
Once you stop a program, you can step through line by line to see what it is doing. You can also step into subroutines, or step back out, running at full speed until the subroutine finishes.
While you step, watch the variables change, flip between the variables in the program and the subroutines it called, or even expand the value of a variable. If the value is from a large matrix, you can even scroll within the variable’s value to see all of the numbers in the matrix.
If you’d like to see the debugger in action, check out this demo video.


