Graph and Manipulate Any Function or Data
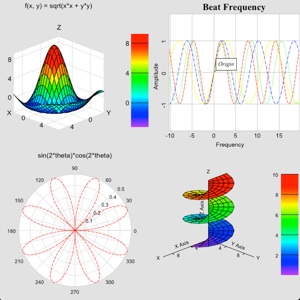
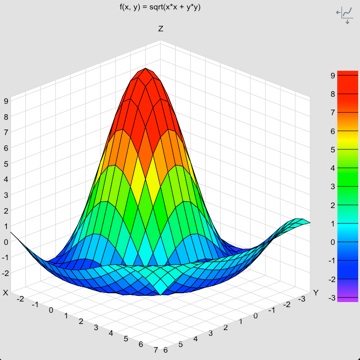
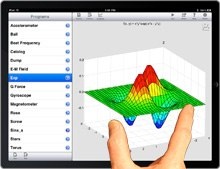
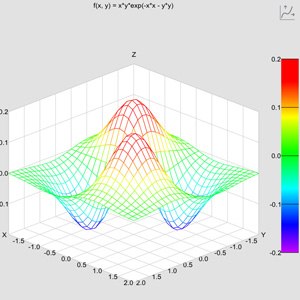
techBASIC comes with several examples that show how to use the program. These can also serve as models for your own programs. One of these is Sinx_x, which plots the function 10*sin(r)/r, where r is the distance from the origin. With the options used in the sample, you get the rainbow colored plot seen here. This is just one of several axis styles and coordinate systems supported by techBASIC.
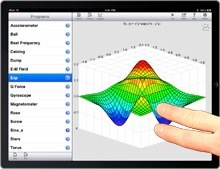
Swiping lets you move around to see various parts of the function. Dragging up and down moves the function along the Z axis, while dragging parallel to the X or Y axis drags the function along one of those axis. As you move, the coordinates along the edge of the bounding box update, as does the legend to the right of the plot.
Use two fingers to pinch or expand the plot. You can zoom in as far as you like—techBASIC recomputes the function as you move or zoom, showing as much detail as you like with no loss of accuracy or increase in pixilation.
You can also take it for a spin—literally! Using two fingers held apart like you are going to start a pinch, twist instead. The function will turn about an axis projecting out of the screen. To twist it about an axis in the screen, use to fingers and drag as if you were trying to turn a sphere with the plot inside. It's easy to manipulate functions to see them from any angle or level of detail.
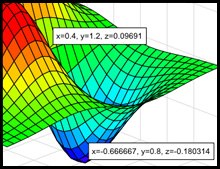
If you tap on the plot, techBASIC will show you the point on the mesh closest to where you tapped, giving the X, Y and Z coordinates. The callout will move around with the plot as you move the plot itself. Tap on the callout to dismiss it. You can add as many as you like.
That's a lot of sophisticated graphing, so it must take a lot or programming, right? Actually, no. Let's take a look. Here's the program that generated the plot:
! Display the graphics view.
system.showGraphics
! Set up the plot, label it, and display the function
! with false color.
DIM p AS Plot
p = graphics.newPlot
p.setTitle("f(x, y) = 10*sin(r)/r; r = sqrt(x*x + y*y)")
p.setGridColor(0.85, 0.85, 0.85)
p.setsurfacestyle(3)
p.setAxisStyle(5)
! Add the function.
DIM func AS PlotFunction
func = p.newFunction(FUNCTION f)
! Adjust the function so the portion under the X-Y
! plane is visible, and push it slightly off the Z
! axis so the beginning of the descending curve
! can be seen.
p.setTranslation3D(-4, -3, -2)
p.setScale3D(1, 1, .8)
END
FUNCTION f(x, y)
d = SQR(x*x + y*y)
IF d = 0 THEN
f = 10
ELSE
f = 10*SIN(d)/d
END if
END FUNCTION
Most of the code consists of comments, and a lot of what is left is actually just selecting various styles for the axis, picking colors, and so forth. All we really need to see the function is this:
DIM p AS Plot
p = graphics.newPlot
DIM func AS PlotFunction
func = p.newFunction(FUNCTION f)
END


