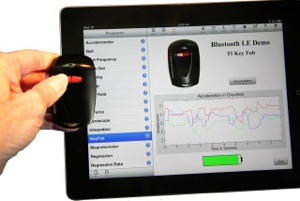
Collect Data from an iPhone Rocket Flight


Collect Data from an iPhone Rocket Flight
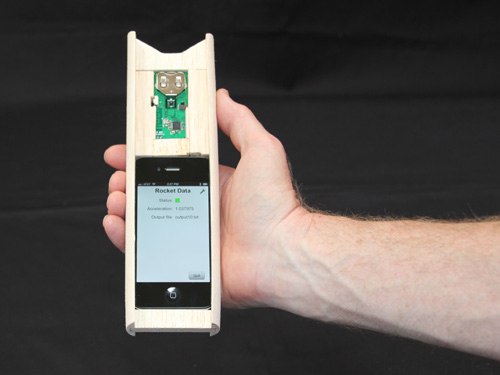
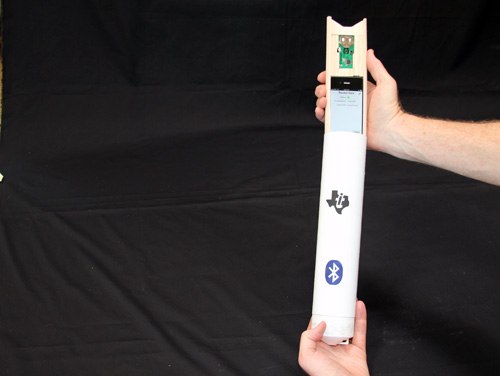
It was a beautiful fall morning as I carefully packed the parachute, slid in the engine, and installed the igniter in my model rocket. I started the data collection program and slid the payload with a TI Bluetooth low energy SensorTag and an iPhone 4s into the payload bay.
Yes, an iPhone.
My wife's iPhone.
Gulp.
Silently, I recited the astronaut's prayer, "Dear Lord, please don't let me screw up." Then I pushed the launch button.
Wednesday, October 31, 2012
ST-1: The SensorTag Rocket

Construction is pretty straightforward. I started with an Estes Loadstar II kit, making a couple of modifications. I added a fourth fin to match the design of the larger ST-2, and substituted a longer, sleeker looking nose code from my parts bin. Neither change is really necessary; you can simply build the kit as designed and it will work just fine.
The holder for the SensorTag is built much like the mount in the ST-2. The main form is cut from a single piece of ¼ inch thick balsa. A notch is cut to make room for the pairing button. Cut strips of 1/32 x 1/8 inch balsa and glue them to the inside edge to form a slot for the SensorTag. Once again, note that the strips stop about half way down on one edge so the thicker components on the SensorTag near the battery have room. I added a 1/4 x 1/16 inch strip at the bottom, carving a notch to accommodate it. This was really for esthetics. You could easily omit this strip, making the cutout area ¼ inch shorter. For that matter, you could just stuff the SensorTag into the payload tube and pad it with a little cotton, but where's the fun in that?
Flight Tips
I'll share a few tips in this section. I did a few things right and a couple of things wrong, so you get the benefit of my mistakes!
Engines
I started with small engines. The B4-2 was perfect for the ST-1. You could, of course, use a C6-5, but expect to loose the signal during the flight if you do. Still, you will have all the data you need to calculate the maximum velocity, which is a pretty cool calculation.
I used a D12-3 for the ST-2. Do not use the D12-5—this is a heavy rocket, and those extra two seconds are enough to let it get dangerously close to the ground before the parachute opens. The engine mount allows for E engines, too, and I will be trying the E12-4 and perhaps the E12-6 soon. Unfortunately, the original ST-2 is currently on its way to Norway so the engineers at TI can take it to a trade show, and I didn't want to risk another flight before the trip. I highly recommend flying the rocket first with lead fishing weights in the payload to simulate the weight of the iPhone if you try any engine other than the D12-3. It would be sad to loose the rocket because the ejection delay was too long, but it would be a lot sadder to loose the SensorTag and iPhone. Even NASA did test flights before they risked people in a new rocket.
Parachutes
I used an 18-inch nylon parachute. If you've launched eggs, you know it's a bit risky to use a flimsy plastic parachute, and probably have a few nylon ones in your launch kit. In retrospect, the parachute was too small, leading to a broken fin on each launch. I'm going to switch to a 24-inch parachute or use two 18-inch parachutes on future flights, attaching one parachute to the booster and another to the payload.
Flight Conditions
Pick a day with very little wind. I really wasn't too worried about breaking the iPhone or SensorTag. While I'm not going to put this theory to a test, I suspect that they are packed well enough that both would survive even if the parachute failed. I was very worried about loosing them altogether. As you can see from the movie, we have a great launch site here in Albuquerque, with almost no obstructions for hundreds of yards. I also picked a time with so little wind that, on one launch, the rocket landed closer to where I was standing than the launch pad.
Power Up!
Turn the SensorTag on just before launch, make sure you have a green light on the data program, then launch quickly. Turn the data off as soon as you can after the launch. Less extraneous data means less processing time.
The Data
Collecting the Data
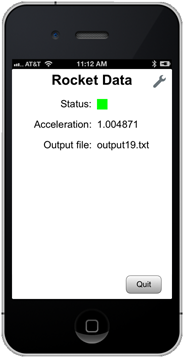
The status indicator will start off red when you run the program. Press the pairing button on the SensorTag and wait a few seconds. The status will change to yellow when the program finds the SensorTag, and to green once the accelerometer, gyroscope and barometer start sending data to the iPhone. The current acceleration is shown, and should update fairly often unless the SensorTag is perfectly still. Press the pairing button again if you don't see the status change to yellow and green after a few seconds.
The data collection program is very simple, dumping the information to a CSV data file. The name of the file is shown. In the screen shot, it's output19.txt. You can move this file to a desktop computer for further analysis or, as you'll see in a moment, analyze it right on your iPhone or iPad. Once again, the techBASIC Quick Start Guide will walk you through moving the data files to and from techBASIC.
Analyzing the Data
Data analysis can be very simple or very elaborate. Let's start simple.
The data file is a series of lines with several comma-separated values on each line. Here are a few lines from one of my rocket flights.
acceleration,372263872.779401004314,-0.09375,-0.9375,-0.015625
acceleration,372263872.7796189785,-0.09375,-0.9375,-0.015625
acceleration,372263872.808314025402,-0.078125,-0.890625,-0.015625
pressure,372263872.958292007446,0.837329
rotation,372263873.168398022652,7.606506,3.944397,-6.614685
acceleration,372263873.708128988743,-0.078125,-0.96875,-0.046875
acceleration,372263873.708782017231,-0.078125,-0.96875,-0.046875
Each line starts with a tag specifying the sensor that reported the data. Next is a time stamp indicating when the data was collected. For acceleration and pressure, the next three values are the acceleration in Gs along the X, Y and Z axis, or the rotation in degrees per second along each axis. For rotation, the single value is the pressure in Bars. And no, the barometer is not broken—we're a mile high here in Albuquerque, and the pressure is a bit lower here.
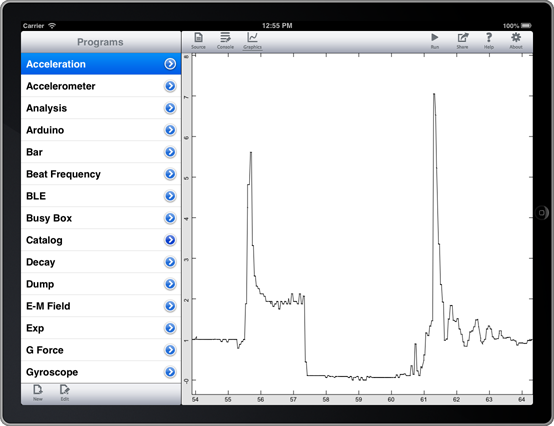
CSV files like this one are very easy to import into spreadsheets and databases, and also very easy to read into BASIC programs. Here's a short techBASIC program that reads the data from a rocket flight and plots the acceleration.
! Scan the file and count the number of data points.
accelCount% = 0
startTime# = -1
name$ = "flight1i.txt"
OPEN name$ FOR INPUT AS #1
WHILE NOT EOF(1)
INPUT #1, tag$, time#, x, y, z
IF tag$ = "acceleration" THEN
IF startTime# = -1 THEN
startTime# = time#
END IF
accelCount% = accelCount% + 1
END IF
WEND
CLOSE #1
IF accelCount% > 16383 THEN accelCount% = 16383
! Read the acceleration data.
DIM accel(accelCount%, 2)
OPEN name$ FOR INPUT AS #1
index% = 1
WHILE NOT EOF(1)
INPUT #1, tag$, time#, x, y, z
IF tag$ = "acceleration" THEN
IF index% <= accelCount% THEN
accel(index%, 1) = time# - startTime#
accel(index%, 2) = SQR(x*x + y*y + z*z)
index% = index% + 1
END IF
END IF
WEND
CLOSE #1
! Create the plot.
DIM p AS Plot, d AS PlotPoint
p = Graphics.newPlot
d = p.newPlot(accel)
System.showGraphics
The rocket lifted off smoothly, arcing into the air. The parachute deployed. Landing broke off a fin, but pulling the payload out, I saw the iPhone was still working, still collecting acceleration, rotation and pressure!
We launched three more times that morning, once more with the same rocket after a quick field repair, and twice with another rocket that carries the SensorTag without an iPhone, transmitting the data using Bluetooth low energy to an iPhone held safely on the ground. This blog shows how it's done. You'll get plans to build the rockets, programs to collect and analyze data, and even the data from our four rocket fights.
Parts List
ST-1: Carries the SensorTag, with remote sensing by a ground-based iPad or iPhone

1.Estes Loadstart II Kit.
2.¼ inch balsa sheet, about 1 ½ x 4 inches.
3.1/32 x 1/8 inch balsa strips, about 6 inches total.
4.1/16 x 1/8 inch balsa strip, 1 ½ inch long.
5.B4-2 engine.
ST-2: Carries the SensorTag and an iPhone

1.Launch lug (Estes part 302320 – Launch Lug Pack, or similar).
2.Two BT80 body tubes (Estes part 303090 – BT-80 Body Tubes).
3.Two (yes, two!) NC-80b nose cones (Estes part 303168).
4.24 inch nylon parachute or two 18 inch nylon parachutes (Estes part 002261 – Pro Series II 24 inch nylon parachute, or similar).
5.Shock cord (Estes part 302278 – Shock Cords & Mount Pack, or a stiff elastic cord from the fabric store).
6.D and E Engine Mount (Estes part 303159 – D and E Engine Mount Kit, or similar).
7.1/8 x 4 x 36 inch balsa sheet for fins and payload bay construction.
8.Two 1 ½ x ¼ x 9 inch balsa strips (if you have a router) or two 1 ½ x 1/8 x 18 inch balsa strips and four 1/8 x 9/16 x 9 inch strips.
9.1/32 x 3/8 balsa strips, about 6 inches total.
10.3/8 inch balsa sheet, about 3 x 6 inches, for various parts of the payload section.
Other Items for Both Rockets
1.iPhone 4s or later, or iPad 3 or later for data collection. Either works with the ST-1, but only the iPhone will work with the ST-2.
2.iPad or iPhone for data analysis.
3.Texas Instruments SensorTag for collecting the data.
4.techBASIC for recording and analyzing the data.
5.Paint, wood glue, 5 minute epoxy glue.
6.Clear ink jet label sheets if you want to add the decals (Avery 5165 or similar)
Why Use a SensorTag?
Before we get started, it's fair to ask a very obvious question. This blog shows how to collect acceleration, rotation and pressure from the SensorTag. Other than pressure, though, the iPhone can already do this by itself. It has an accelerometer, and most models have a gyroscope. Why bother with the SensorTag, other than pressure?
While the iPhone has an accelerometer, the iOS software limits it to ±2G. That's just not good enough for a model rocket. We'll see that the rockets pull between 5Gs and 8Gs during the boost phase of flight, and can easily top 8Gs when the parachute deploys. Like the iPhone, the SensorTag is also normally limited to ±2G, but that's set in firmware and easily changed. The friendly engineers at TI whipped off a special version of the firmware that supports ±8Gs. This firmware build is included in the download at the end of the blog, and is also available on the TI website near the bottom of this page.
The SensorTag also gives us an option not available with the iPhone itself. We don't have to fly the iPhone at all to get the data. For about the first 40 meters (yards) of flight, we can hold our precious iPhone safely in our hands and still get flight data. While we still need to fly the iPhone for higher flights with more powerful engines, a high school physics class can easily collect data without risking an iPhone.
Construction
There are two ways to get data on your iPhone, and we'll build rockets for both. Let's start with the larger rocket that flies both the iPhone and the TI SensorTag in the same payload.
ST-2: The iPhone/SensorTag Rocket
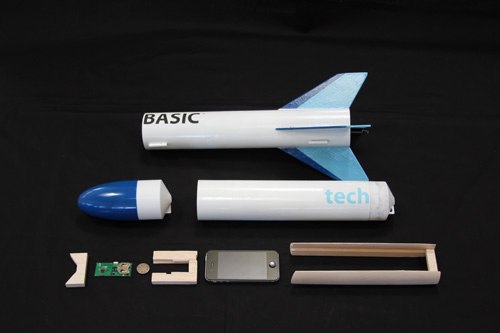
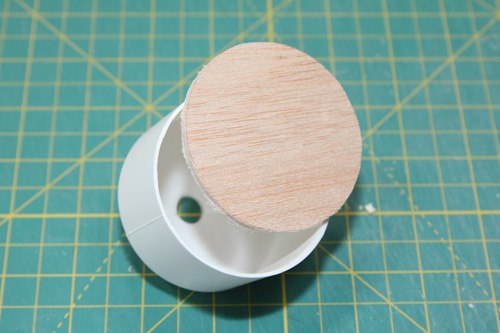
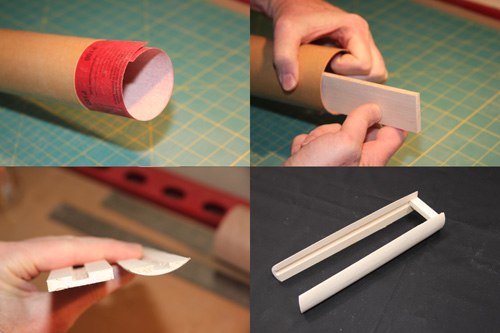
With the pieces in place, the next step is to sand a curve on the outside of the pieces so they slide smoothly into the body tube. Place a sheet of sandpaper in a body tube and start sanding! When you are finished, the side pieces should lay snugly against the inside wall of the body tube. Glue a 2 5/16 x 3/8 x ½ inch piece of balsa across the bottom of the side bars to form the main piece for the payload section.
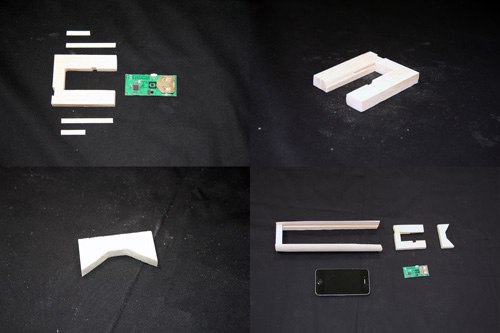
Cut the end piece from 3/8 inch balsa, making it just a tad longer than needed.
Don't glue these pieces into the side rails! Once complete, slide in the iPhone, slip the SensorTag into its holder and slide the holder on top of the iPhone, and cap it off with the end piece.
This program is a bit more powerful and, as a result, a bit longer. There are links at the end of the blog that will help if you want to dig into the program.
The picker lets you select from any available rocket data. It is showing four data files from our rocket flights. Edit these lines near the start of the program to add your own data:
! Create the list of files we can display and process.
count = 4
DIM files$(count), flightT0(count), flightT1(count), calibT0(count), calibT1(count)
files$(1) = "flight1i.txt"
files$(2) = "flight2i.txt"
files$(3) = "flight1.txt"
files$(4) = "flight2.txt"
Change the value of count to the number of data files the program will list, and add any new files by adding another line like the last four lines shown.
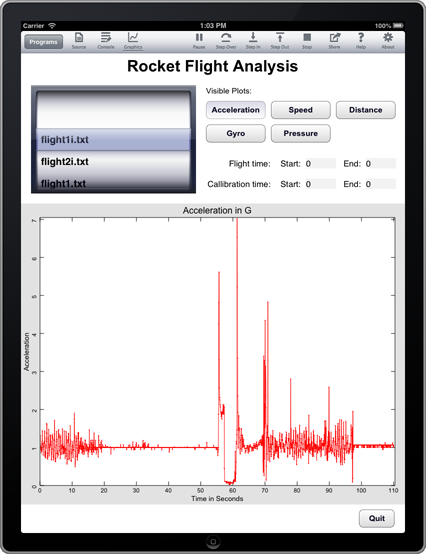
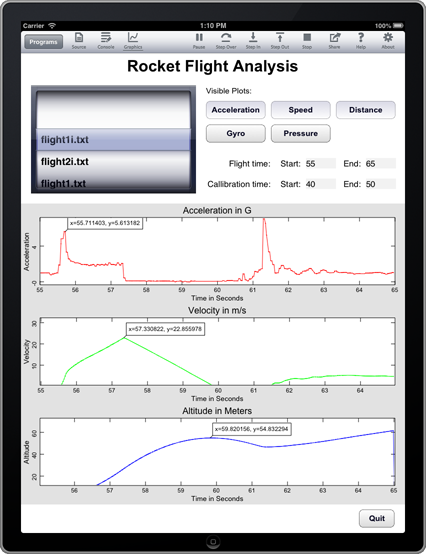
The buttons at the right let you show or hide the five plots used to analyze the data. Acceleration is the most interesting, so let's start there.
Rocket Data Analysis
While the short program shows how easy it is to analyze data, we're going to use a more sophisticated program to look at the results from our rocket flights. As with the data collection program, the source is in the download at the end of this blog.
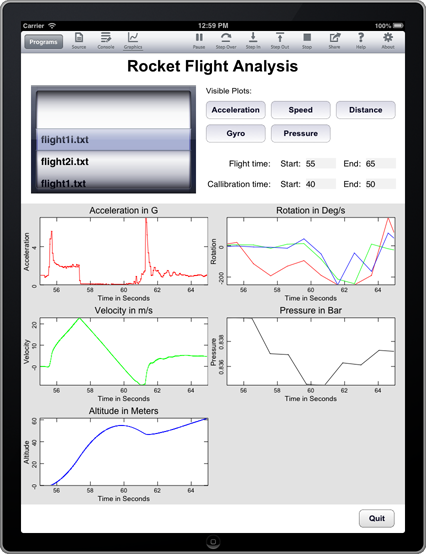
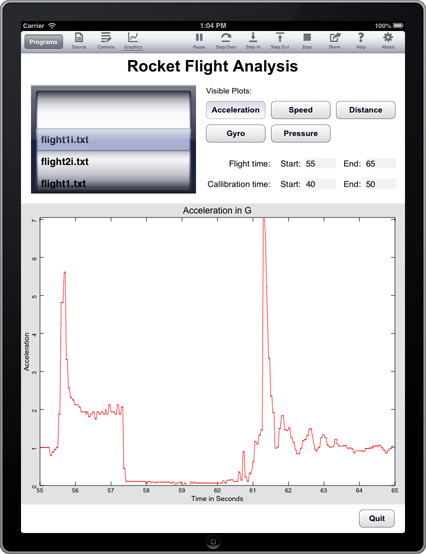
The original plot shows a lot of extra stuff, like the jostling as the payload is assembled, the long wait before the rocket launches, and the handling after the flight. We don't really need to see all of that. Set the start and end flight time by tapping the gray time box and entering appropriate values, and the interesting part of the data pops out. For this flight I used a start time of 55 seconds and an end time of 65 seconds.
Now you can see the flight. As the rocket lifts off, the G force climbs rapidly to 5.6G, then drops to about 2G and holds fairly steady for about one and a half seconds. The rocket then starts to coast, burning through a smoke charge that lets it move along at a bit more than 0G for a few more seconds. The ejection charge deploys the parachute, and the payload bounces around a bit during descent. An interesting point is that the parachute deployment, not the rocket engine, causes the highest G force.
Velocity and Altitude
But who cares about acceleration—we want to know how fast it went and how high it got, right? Not so fast—there are problems with that calculation. It seems so simple in physics class; you just multiply the acceleration by the time to get the velocity, and velocity times time to get distance. What could be easier?
Practice is a bit messier than theory. All measurements have error. There are three kinds that mess us up a bit when using an accelerometer to find speed and distance. The first is calibration error. The accelerometer is supposed to measure 1G sitting on the pad, but a quick look at the data shows it doesn't. It's close, but not quite there. We can limit this type of error, though. The program has a place to enter a calibration time. Pick ten seconds or so just before the rocket lifts off, when it should be at 1G. The program will find the measured acceleration and adjust the rest of the data appropriately.
So we're good, right? Not quite. Another kind of error occurs due to random fluctuations in the measurements. Let's see how this messes us up.
Let's say the first acceleration measurement is off by 0.02G, reporting 2.02G when it should have been 2.0G exactly. That's not much, right? After 0.1 seconds, we get
v = 2.02*0.1 = 0.202 m/s
d = 0.202*0.1 = 0.0202 m
Not bad, we're only off by 0.02 millimeters. But now that error gets compounded on each subsequent calculation. Every single calculation will add another 0.0002 m to the distance that shouldn't be there. And that's just for a single, very small error on a single measurement—there are hundreds of chances to mess up, since there are hundreds of measurements.
The last, and most insidious, kind of error is systematic error. This is error that isn't random, but weights the results in the same direction each time a measurement is made. Calibration gets rid of a lot of the systematic error, but not all of it. Some is still there because of error in the calibration, but some creeps back in because we only calibrated for 1G. What happens if the accelerometer is fine at 1G, but off a bit at 2G, and off even more at 3G? This is just one way for systematic error to alter our results.
Finally, the program makes some simplifying assumptions. It assumes the rocket goes straight up and comes straight back down, but in reality, it will arc a bit. The program also assumes the rocket never experiences negative Gs, where drag is slowing it down at a faster rate than 1G. These assumptions add additional errors to the calculation. It's a great opportunity for further programming on your part. My gut feel is that the speed and altitude are probably good to plus or minus 20% or so up until the ejection charge fires, and essentially worthless after the rocket starts bouncing around on the parachute. The calculations and observations of the height seem to bear that out. Proper error analysis is easily another complete blog, though.
Blah, blah, blah. But how fast and high did it go?
Well, keeping in mind that the results could be off a bit due to error, this flight of the ST-2 with a D12-3 engine pulled 5.6G. The peak velocity was right after the engine burned out and the rocket started to coast, clocking in at 22.8 m/s or about 51 miles/hour (82 km/hour). The maximum altitude was 54.8 m, which is about 180 feet.
Rotation and Pressure
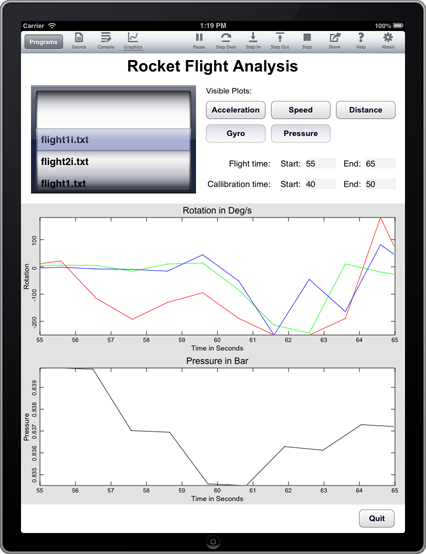
I wasn't expecting much from rotation or pressure measurements. Acceleration can be reported every 0.1 seconds, but pressure and rotation are only reported about once a second. These measurements could be pretty interesting on longer flights with bigger engines, though.
Rotation did tell me a bit. The rotation was lower during powered flight than I expected, so I guess those fins were on straight! You can see rotation around Y and Z (green and blue, respectively) pick up a bit as the rocket arced over during the coast phase. Of course, once the parachute came out, the payload was rotating all over the place.
Pressure really didn't help much on this short flight.
What We Found
ST-1 Results
Two of the data sets, flight1.txt and flight2.txt, are from the ST-1, which only carried the sensor tag. As you can see, there is some data loss in each flight. Oddly, the connection was not lost—perhaps it was reestablished quickly enough that the iPhone's O/S didn't completely sever the link. The maximum acceleration on the first flight hit or exceeded 8G for a moment, then dropped to about 3G. There was some data loss during the maximum boost phase on the second flight, but the data picked up again while the rocket was still pulling around 3G.
So why did a tiny B4-2 engine pull 8G wile a D12-3 only got to 5.8G? The rocket is much lighter, so from
f = ma
we see that the lighter rocket can accelerate much faster. There are a lot of fun calculations here for a high school physics class. I won't spoil all of the fun, but I will pass on the launch weights of the rockets. The ST-1 weighed in at 114g, while the ST-2 was 396g.
ST-2 Results
Two additional data sets, flight1i.txt and flight2i.txt, are from the ST-2, which carried the iPhone along with the sensor tag. One of the ST-2 flights was analyzed earlier. The second flight was pretty similar to the first.
There are all sorts of changes and improvements you can make, depending on your interest. Larger, more powerful rockets can carry the payload faster and higher. Different engines will yield different results. More careful data and error analysis can glean more from the information than shown here. The TI SensorTag also has sensors for humidity, temperature and magnetic fields, and the iPhone has sensors for rotation and magnetic fields. There's a lot to explore as you build and adapt this project!
More info
Here’s the main techBASIC page, where you can explore how techBASIC lets you collect, analyze and manipulate information. techBASIC supports data collection with internal iPhone and iPad sensors, Bluetooth low energy and HiJack. You can process this information with a powerful, matrix-rich technical computing language. Display and manipulate the information with amazing interactive graphics and fully interactive graphical user interfaces.
This wiki gives all of the basic information about the SensorTag used to collect data, including setting it up and installing firmware.
Writing Bluetooth low energy Programs
This blog steps through the details of detecting and communicating with Bluetooth low energy devices with techBASIC. In fact, the data collection program for the blog you are reading was adapted from the program from this blog. You don't need this information to use the programs supplied, but it will help if you want to modify them or write your own.
This blog shows how to create interactive user interfaces from your iPhone or iPad using techBASIC. Along with the other blogs, it gives the background information you need to understand how the data analysis program was written without having to resort to the 300-plus page reference manual. Again, this information is only needed if you want to modify the programs included here or write your own.
This blog shows how to create the plots used in the data analysis program. Like the other blogs, you can skip it if you don't want to change the graphs in the data analysis program.
The Data and Software Download
Update: New Data!
The data and software download now has two new data files from flights of the ST-2 using E6-4 engines. Compare the results from flying D and E engines!
The download contains the following files.
Analysis.bas
This is the analysis program used to view plots of acceleration, speed, altitude, pressure and rotation. While the blog shows it on the iPad, it also works on an iPhone. (There are two versions, one for techBASIC 2.4 and one for the current techBASIC 2.3 release.)
E9-4a.txt
This is the raw data from the first flight of ST-2 with an E engine.
E9-4b.txt
This is the raw data from the second flight of ST-2 with an E engine.
flight1.txt
This is the raw data from the first flight of ST-1. There is some data loss, but you can see what that looks like.
flight1i.txt
This is the raw data from the first flight of ST-2. It's a very nice, clean data set.
flight2.txt
This is the raw data from the second flight of ST-1. Again, there is some data loss.
flight2i.txt
This is the raw data from the second flight of ST-2. It's also a nice, clean data set.
Rocket Data.bas
This is the program used to collect the data.
This program requires techBASIC 2.4. We had expected Apple to release it through the app store by now; it will be a free update once they do.
RocketDataCalibration.txt
The Analysis.bas program creates this data file to save the flight time and calibration time information you set when using the program. This file has preset values for the included data files.
SensorTag_8g.hex
The TI SensorTag normally sets the accelerometer sensor so it reports acceleration up to 2G, but for rockets, we want more! The wonderful engineers at TI's Norway facility created this special version of the SensorTag firmware to collect data up to 8G. They cautioned me that it is not tested as well as the normal firmware, but it sure works well in the rockets.
Install this file instead of the normal firmware when you set up your SensorTag. You can always replace it later with the official firmware release.
The Plans Download
The download contains the following files.
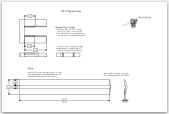
ST-1 Payload Bay.pdf
Detailed plans for the payload bay components in the ST-1. The rocket itself is a Estes kit, so separate plans are not included.
ST-2.pdf
Major component layout for the ST-2.
ST-2 Payload Bay 1.pdf
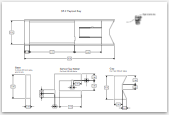
Sheet 1 of the plans for the payload bay mounts that hold the iPhone and Texas Instruments SensorTag.
ST-2 Payload Bay 2.pdf
Sheet 2 of the plans for the payload bay mounts that hold the iPhone and Texas Instruments SensorTag.
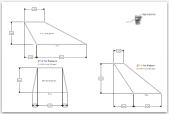
Fin Patterns.pdf
Full size fin patterns for the fins for both the ST-1 and ST-2. An alternate fin design is included for the ST-2.
Decals.jpg
The decals we applied to the ST-1 and ST-2. Print these on clear label paper (available at office supply stores) using your inkjet printer, then apply to the finished rockets.
Click here to find out more about techBASIC, the app used to write the data collection and analysis software.
Click here to learn more about how techBASIC connects to Bluetooth low energy devices and other sensors.


